
If you’re into charts or trying to understand when to buy a stock, there’s one pattern that often signals a strong uptrend. It’s called the “Rising Three Methods pattern.” Despite the name, it’s not complicated. You can spot it easily on a candlestick chart, and it usually means the price may continue going up.
Here’s how it works.
- First, you’ll see a big green candle. That shows buyers are pushing the price up.
- Then come three small red candles. This part makes many traders nervous, but those red candles are not a trend reversal. They’re more like a short break or pause.
- After that, the fifth candle shows up as another big green one that closes higher than the first green candle. That last candle confirms that buyers are back in control.
Here’s how it looks
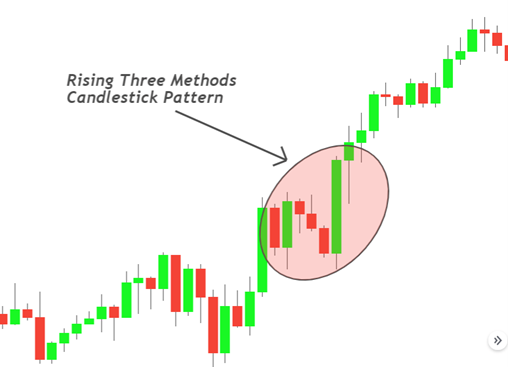
So what you’re really looking for is a strong move up, a quick dip, and then another strong move higher. That’s the pattern. And when it shows up, especially during an existing uptrend, it often means there’s more room to run.
When to Jump In (and When to Chill)
Now, just spotting this pattern isn’t enough. You need to wait for the last candle to finish forming. That’s your confirmation. Many traders make the mistake of jumping in too early, which can lead to losses.
A good way to increase your chances is to look at where this pattern forms. If it shows up around a demand zone or after a breakout, it’s more reliable. Demand zones are areas on the chart where buyers have stepped in before. If the pattern lines up with those areas, it’s a stronger signal.
Always manage your risk. Put a stop loss just below the lowest point in the pattern. That way, if the trade doesn’t work out, your losses are limited.
Pros, Cons, and Real Talk
The reason the Rising Three Methods pattern is powerful is that it shows clear behaviour. Buyers take charge, sellers try to slow things down, but can’t stop the trend. Then buyers return with even more strength. This is how trends continue. It works not just in stocks, but also in crypto and forex.
But remember, no pattern works 100 percent of the time. In sideways or choppy markets, this setup can fail. That’s why confirmation is key. And it helps to look at other factors like volume or key support levels before making a decision.
If you’re learning to read charts, this is one of the patterns worth knowing. It’s simple, reliable in the right conditions, and gives you a clear entry and exit plan.