I have spent a lot of time discussing the bullish implications of Gold price patterns and the recent Gold breakout attempt.
So why not offer up yet another example of why Gold (and precious metals partner, Silver) are brimming with bullish possibilities.

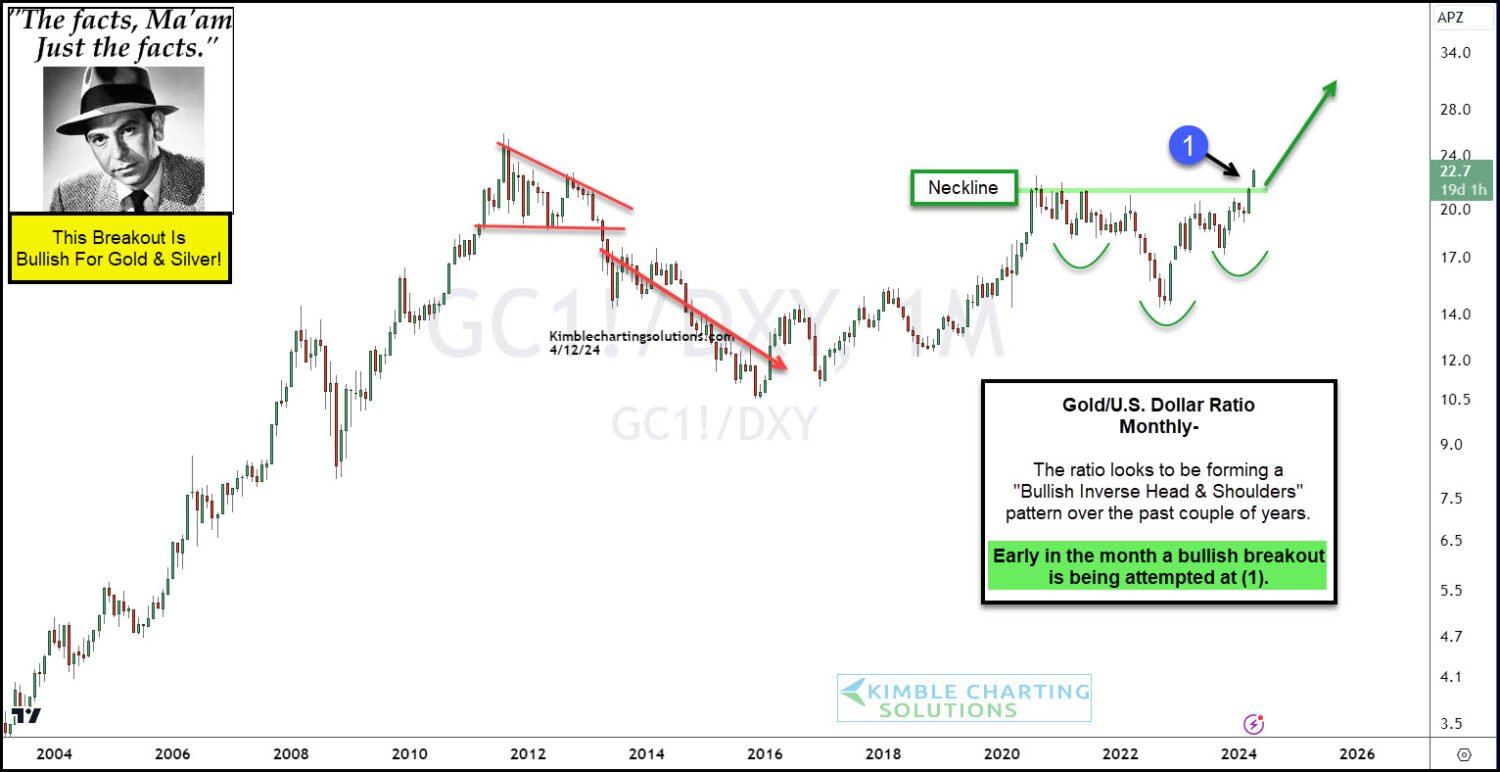
Today’s chart highlights the long-term “monthly” closing ratio of the price of Gold to the US Dollar. And unsurprisingly, the price patterns are historic and very bullish.
We have a large cup that began forming when Gold broke down and out of a bearish triangle (see red lines). Then came the rally into 2020. Since then a handle has formed over the past 4 years (green lines) in the form of an inverse head and shoulders – also bullish.
And now we are seeing Gold attempt a historic breakout at (1).
If this sticks, Gold will have a lot of room to run. Stay tuned.